

Data: What’s the Point?
How Curiosity Can Help Us Put Information in Context
In a post-truth world of “alternative facts,” it can be difficult to sort through and evaluate information. Are data and statistics useful for assessing truth, or are they little more than weapons?
In 2014, an international aid organization made a big splash with a so-called killer fact—a headline-grabbing statistic—to generate unprecedented levels of web traffic. Industry leaders and news outlets almost universally summarized the 32-page report by extracting a single line from it. The headlines read, “85 Richest People as Wealthy as Poorest Half of the World.”
The contrast paints a stark picture of wealth inequality. Unless we analyze that statement carefully, we might visualize a graph that shows a very small number of people holding a huge chunk of global wealth, while fully half the world’s population has nearly nothing. Emotions at the injustice of it all begin to brim.
In his book The Data Detective (2021), Tim Harford points out that this organization’s claim was completely accurate, but the picture that news headlines may have suggested wasn’t. A few more clicks into the report and we also read that the 85 richest people and the poorest half of the world, combined, accounted for only 1.42 percent of global wealth. The vast majority was distributed among the rest of the richest half of the world, or about 3.5 billion people at that time.
The report’s point isn’t in question. Wealth inequality is certainly a pressing social issue, and the fact that 85 superrich individuals hold as much wealth as half the world’s population is stunning. However, if we hope to resolve the issue of wealth inequality, this fact alone is woefully inadequate. It seems unreasonable to suggest that one can have a solid understanding of global wealth inequality without addressing the other 98.58 percent of wealth.
We’re likely to come across killer facts on a range of issues. They are by definition irrefutable and decisive, intended not only to grab headlines but to effectively kill off any opposing argument. Importantly, their purpose is generally not to deceive.
“‘Killer facts’ are those punchy, memorable, headline-grabbing statistics that make reports special. They cut through the technicalities to fire people up about changing the world.”
It can be quite tempting to believe that pithy and punchy statistics can accurately summarize a given social issue. But the world we live in is imperfect and complex. Scientific analysis is based on the principle of making a hypothesis and then testing it by removing, or otherwise accounting for, all other variables. This is not always feasible; in complex systems, variables are not easily identified or defined.
This is not to say scientific analysis isn’t useful. On the contrary, scientific and statistical analysis have played a vital role in our understanding of global health, sanitation, climate change and other issues. In today’s post-truth era, however, it can be difficult to correctly interpret all the scientific data and studies that fill our newsfeeds.
This begs a question, then: How should we view the facts we come across? How can we use data to make sound judgments? Is it even possible?
What’s the Value of a Number?
Perhaps it’s helpful to remember the significant role that large-scale data has played in the past. One of the benefits of looking at large data sets is that they can elucidate patterns that are hidden if we look only at our personal experience.
One example is Florence Nightingale’s famous rose (or coxcomb) chart demonstrating the importance of handwashing and sanitary practices in hospital settings. While serving as a nurse during the Crimean War, she meticulously tracked the death rate of soldiers who came through the military hospital. The sanitary conditions in the hospital were horrific. After she and her nurses implemented drastic changes to hospital routines and scrubbed the wards as best they could, she implored her superiors back in England for additional support. They sent a sanitary commission in the spring of 1855 to improve the ventilation, clear away the remaining filth—including dead animals—and flush out the water tanks and sewage drains.
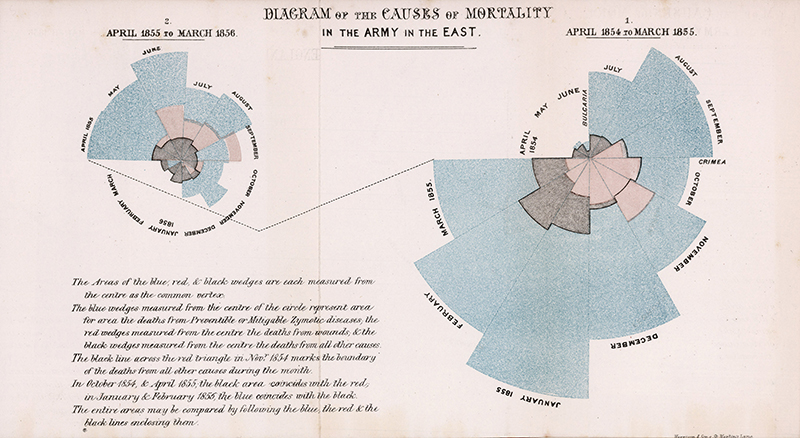
In an early variation on the pie chart, Florence Nightingale created the “Diagram of the Causes of Mortality in the Army in the East.” It depicts the number of British soldiers who died from various causes while hospitalized during the Crimean War in the mid-1850s, clearly showing a link between improved sanitation and reduced deaths from preventable diseases (shown in blue).
Florence Nightingale, Public domain, via Wikimedia Commons
Because of Nightingale’s consistent data collection, it became clear that these efforts to improve sanitary conditions reduced the soldiers’ death rate from more than 50 percent to 20 percent. It seems obvious from a modern perspective that this would be the case, but in the mid-1800s germ theory was still in its infancy. No doctor at the time would have anticipated such a dramatic effect from washing hands, improving sewers and removing dead animals. Because of her detailed research, she was able to campaign for improved sanitation in British public health and hospitals upon her return.
Similarly, the link between smoking and lung cancer became apparent with the help of large data sets. In the early 20th century, many thought that the rise in lung cancer was connected to, among other things, increased automobile traffic. By the early 1950s, an increasing number of researchers were publishing studies confirming smoking as a leading cause. British researchers Richard Doll and Austin Bradford Hill were among them. Three years before their 1954 report, Doll and Hill sent all 59,600 British doctors a questionnaire about their smoking habits. Focusing on the 789 doctors who had died since completing the questionnaire, they analyzed both their smoking habits and their cause of death and were able to demonstrate the connection between smoking and lung cancer. If health-care experts hadn’t been able to look at the big picture, and act on it, many more would have died.
Easy as 1, 2, 3
Rigorous statistical analysis by Nightingale, Doll and Hill helped us understand the world a bit better. There’s a common misconception, though, that numbers are always an illustration of objective truth. The saying goes, numbers don’t lie. However, numbers can quickly go astray when removed from their original context.
One statistic that benefits from contextual review is the notoriously high infant mortality rate (IMR) in the United States. In a 2014 issue of the US Department of Health and Human Services’ (DHHS) National Vital Statistics Reports, researchers undertook a comparison of factors relating to infant mortality. They reported at the outset that as of 2010 the US IMR was 6.1 deaths per thousand live births; in Finland it was 2.3.
Reporting and counting an infant death, though grievous, seems relatively straightforward. But as the report implies, this turns out not to be the case. In clinical practice, births around the threshold of viability, or around 500g birthweight and younger than 22 weeks’ gestation, are not reported in a uniform way. (A gestational age of 22 weeks is an important threshold, after which the survival rate dramatically increases.) If a child is born before or around 22 weeks’ gestation and lives for a short time before expiring, some doctors record this as a miscarriage or stillbirth; but it varies internationally, within countries and even between hospitals in the same cities.
With such inconsistency in reporting, viewing the US rate of 6.1 deaths per thousand live births alongside Finland’s 2.3 isn’t a fair comparison. In order to compare apples to apples, the 2014 DHHS report proceeded by including only those infant mortalities that occurred at 24 weeks or later. On that basis, the authors pointed out, the United States dropped substantially from 6.1 to 4.2 deaths per thousand live births (still higher than in many nations), but Finland’s barely changed from 2.3 to 2.1. The difference in how individual doctors define and report infant death does have an effect on how we interpret the data.
Statistics can help us understand the world around us in a broader scope, but when research is boiled down to a single statistic, it’s not typically capable of telling the full story. Understanding the context of a statistic, such as what was measured and how, is critical to drawing the appropriate conclusions.
Can We Handle the Truth?
Sometimes the context of a particular study is obscure, but other times it’s our own thinking that needs to be adjusted. Even when we do understand the context, we often still struggle to accept new information that differs from our current worldview.
We tend to go out of our way to avoid information that conflicts with our perspective. Rather than experience the uncomfortable challenging of our beliefs, we choose to limit our information intake to sources we know we can readily agree with. In one study, subjects were asked to listen to and evaluate provocative messages. Each talk was slightly obscured by static, however, and the subjects were given a button that they could press to remove the interference. When Christians were asked to listen to a talk about the evils of Christianity, they hardly touched the button, whereas those with weak ties to Christianity were eager to hear the message more clearly. When smokers listened to a talk explaining that their habit was perfectly safe, they pressed the button enthusiastically. They were significantly less inclined to clear the static in a talk linking smoking to lung cancer. This type of selective exposure to information is exacerbated in the highly individualized way in which we receive the news.
“We often find ways to dismiss evidence that we don’t like. And the opposite is true, too: when evidence seems to support our preconceptions, we are less likely to look too closely for flaws.”
It’s particularly difficult to honestly assess information that conflicts with one’s political identity. Dan Kahan, a professor of law and psychology at Yale University, designed a study testing just that. He and his colleagues started by showing participants a protest video. Some were told it was a pro-life demonstration, others were told it was a gay-rights demonstration. They found that participants’ political leanings determined whether they saw the protest as peaceful or violent. Our political identities distort our perception of reality and alter how we label the behavior of others.
Given our predisposed nature to avoid uncomfortable information, sorting through our emotions as we take in news media is increasingly important. We need to pause and double-check our gut reactions. If a news item leaves us feeling smug or vindicated, for instance, we might need to reconsider it: Are we sure our source has given us the whole picture, or have we missed out on a nuance or two? Have we restricted our sources to those that are likely to validate our worldview (and are thus probably biased)?
Pictures Are Worth a Thousand Numbers
Charts, graphs and infographics are perhaps the most successful in evoking our emotions. The two graphs below use the same data to tell two different stories. Simon Scarr developed the grim “Iraq’s bloody toll.” Using deep red and flipping the horizontal axis makes the bar graph look like dripping blood. Andy Cotgreave took the same image and flipped it upside down, then swapped the red for a mellow blue. The only other change was the title: “Iraq: Deaths on the decline.” In this way Cotgreave showed that, using almost exactly the same image, graphs can elicit vastly different responses depending on which aspect of the data the creators want to emphasize.
“Any dataset can tell many different legitimate stories,” Cotgreave explained. “A single truth does not exist in any dataset; there are many truths that can be communicated.”
Regarding Scarr’s award-winning graph, Cotgreave pointed out that “this isn’t deception; it’s design put to great effect.”
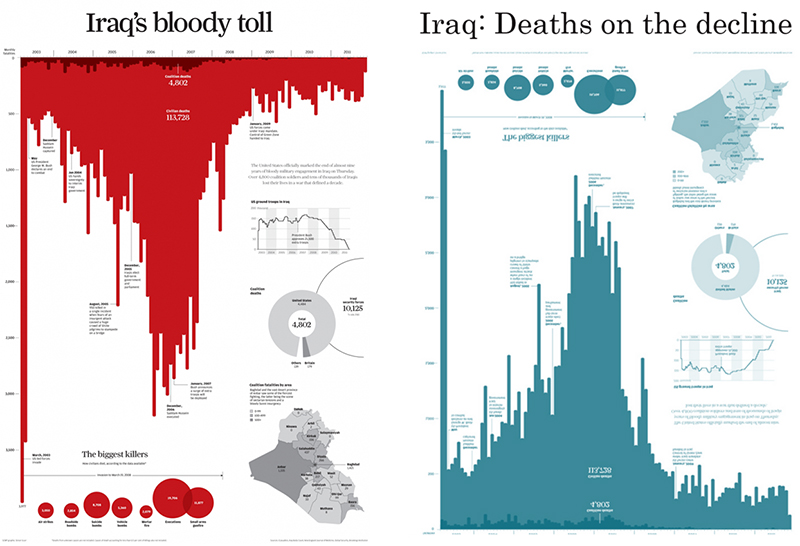
Same data, different message: “Iraq’s bloody toll” employs color and a flipped horizontal axis to evoke dripping blood in its depiction of deaths during the war in Iraq. “Iraq: Deaths on the decline” goes with a calmer color and turns the graph right side up to highlight a different aspect of the story.
“Iraq’s bloody toll” by Simon Scarr, as it appeared in the South China Morning Post (2011); “Iraq: Deaths on the decline” by Andy Cotgreave. Graphs used with permission.
But there are certainly cases where, even if deception isn’t the intent, it’s nevertheless the effect. As a case in point, a 2014 Reuters graphic that quickly went viral depicted gun violence in Florida. Inspired by the “bloody toll” image above, the graph’s creator employed an upside-down orientation. Unfortunately, it wasn’t completely clear that the image was upside down. As a result, it gave the false impression that gun deaths had fallen rather than risen. On her blog, Tulane University sociology professor Lisa Wade compares it to the right-side-up version, adding that the original “is so deeply misleading that I loathe to expose your eyeballs to it.”
Reuters is a respected news organization, but if most people misread this graph, it isn’t useful. “This example is a great reminder that we bring our own assumptions to our reading of any illustration of data,” writes Wade. “The original graph may have broken convention, making the intuitive read of the image incorrect, but the data is, presumably, sound. It’s our responsibility, then, to always do our due diligence in absorbing information. The alternative is to be duped.”
“What people see will often be a reflection of what they value.”
Bar charts are a popular way to help people visualize data, but they can mislead in other ways too. For example, when the American government implemented the Affordable Care Act (also known as Obamacare) several years ago, Fox News, another news-media giant, used a bar chart to showcase the plan’s enrollment numbers to date. While the actual numbers were accurately cited, indicating a shortfall of about one-seventh a few days ahead of the specified date, the height of the bars themselves suggested that enrollment fell nearly two-thirds short of what the government had anticipated. The reason? The vertical axis had been truncated; the measurements didn’t begin at zero, so the shortfall in enrollment appeared much greater than it actually was. After viewers took to the Internet to call the network out on the graph’s deceptive nature, they retracted it and showed a more honest depiction.
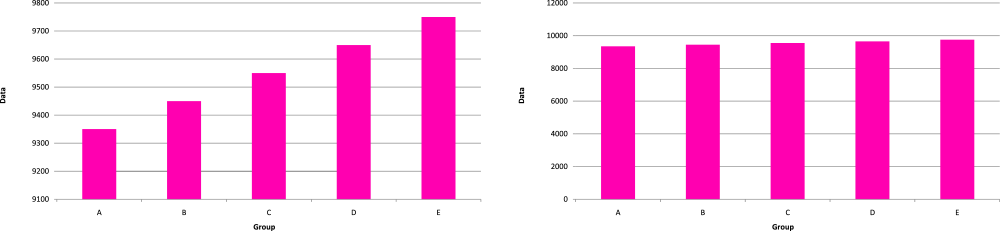
In the truncated bar graph (left), numbers along the vertical axis begin at 9100, giving the impression of significant differences in the data being measured. In the bar graph on the right, the data are the same but the vertical axis begins at zero.
Smallman12q, CC0, via Wikimedia Commons
Curiouser and Curiouser . . .
While many truths can be communicated by a single data set, our natural instinct gravitates toward interpreting data in a way that reinforces our opinions, biases and emotions. So how do we overcome this to be more informed or make better decisions? It’s clearly in our best interest to analyze data with the intention of understanding its true relevance. To that end, a little curiosity seems to make a world of difference.
Philip Tetlock, professor of psychology and political science at the University of Pennsylvania, developed the Good Judgment Project. In his research on making sound judgments, he asked people, ordinary and expert alike, to try forecasting the likelihood of world events. Tetlock found that most people generally forecast poorly, but a small minority were consistently quite good. One of the most encouraging findings of these “superforecasters,” as they became known, was their open-minded and curious attitude. They sought out opposing information and diverse perspectives, and they used failure to help them refine their positions. “For superforecasters,” Tetlock writes, “beliefs are hypotheses to be tested, not treasures to be guarded.”
This open-mindedness, or curiosity, is not simply a thirst for technical knowledge or scientific literacy, which notably does not make us immune from bias; in the United States, for example, Republicans and Democrats with a high level of scientific literacy are further apart on climate change than those with little scientific education. Scientific curiosity speaks to the ability to hear and synthesize input from many, varied and sometimes unexpected sources. It also means we can recognize our own emotions and biases, and when it’s time to discard or revise a previous position.
There’s a reason that superforecasters are the small minority; cultivating curiosity requires a certain amount of humility and an openness to new understanding. Curious minds, even when well-studied or impassioned, seek to continually improve ideas. Superforecasters, being focused on the idea being right rather than on the person being right, can quickly integrate new ideas into their perspective. This adds depth of understanding, contributing to their ability to more accurately forecast outcomes.
This research on superforecasters is relatively recent, but the principle is not new. The idea that we should employ humility and open-mindedness in order to make wise judgments goes back thousands of years. The biblical book of Proverbs, for example, declares that “when pride comes, then comes disgrace, but with humility comes wisdom.” Recent research on how we interpret data is an excellent reminder of such age-old principles and the need to apply them in the 21st century.

While we may not be superforecasters, we all have opportunities to practice the open-mindedness and curiosity that makes them so successful. The media we consume provides regular occasions for us to refine our approach to data and statistics. Rather than allowing killer facts to stifle the conversation, we can instead foster curiosity and test our ideas and perspectives by asking questions. What is the context of this statistic or piece of information, and what are the implications? Why do some people believe it and others do not? How is it that others have come to form different opinions on this issue? We might be surprised if we take a genuine, curious look at positions we disagree with, recognizing that maybe we just don’t fully understand them.
A statistic or other piece of data in a vacuum will only ever be able to convey part of the story. We need a bit of curiosity and probing to gain a more robust understanding of complex issues. Imagine if we hadn’t listened to Nightingale, or to Doll and Hill, and continued to reject the notions that good hygiene saves lives, or that smoking causes cancer. When we see information that conflicts with our current worldview, we have a choice. We can dismiss it, as we are wont to do. Or, we can be curious and take it as an opportunity to test and refine our worldview to gain a clearer picture.